Data analysis and social listening
Engagement Rate
Definition:Engagement rate is a ratio that measures how much interaction social media content generates: the interactions (such as likes, comments, shares, saves and clicks) on a single post or over a period are divided by a base that represents how often the content was seen or how large the audience is, then multiplied by 100 to give a percentage. The base may be impressions, views, reach (unique accounts) or followers. Native platform analytics and social media management tools use different numerators and denominators, so the same post often shows different engagement rates in different places.
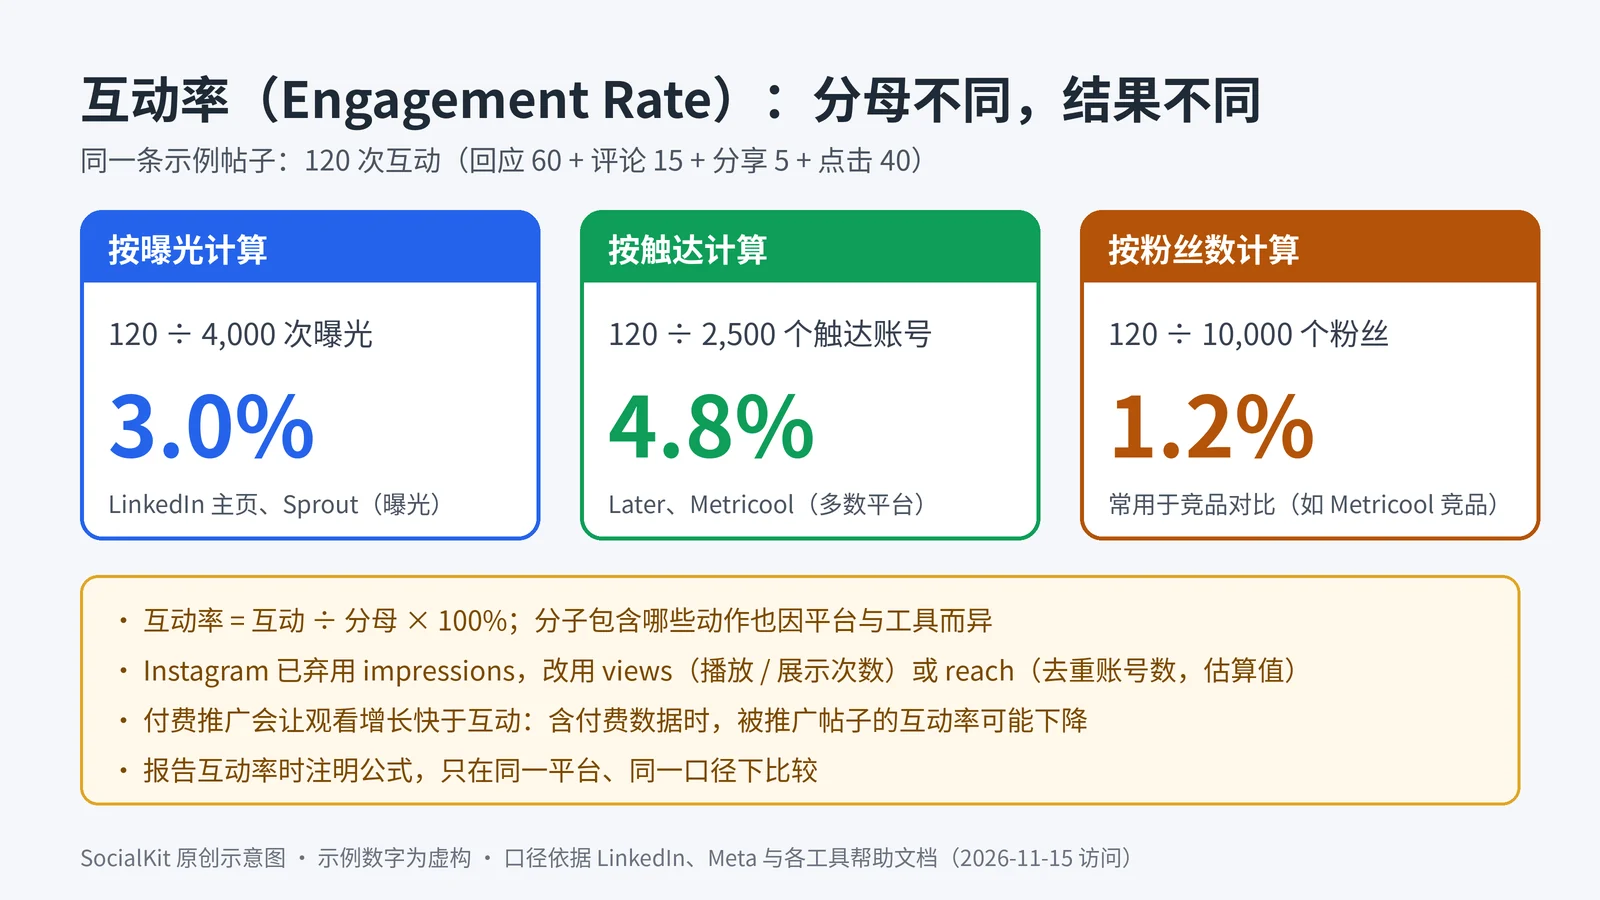
How it works
- Define the numerator (interactions): first check which actions the platform or tool counts. LinkedIn Page analytics counts clicks, reactions, comments and shares; total_interactions in Instagram's API is the sum of likes, saves, comments and shares, minus unlikes, unsaves and deleted comments.
- Choose the denominator: impressions or views measure interactions per display; reach measures the share of accounts that saw the content and interacted; followers measure interactions relative to account size and are often used to compare competitor accounts whose analytics you cannot see.
- Calculate the ratio: engagement rate = interactions ÷ denominator × 100%. Metricool also lets you show interactions per 1,000 people reached (×1000), in which case the value is not a percentage.
- Aggregate several posts: you can divide total interactions by the total denominator, or calculate each post's rate and average them. Hootsuite's developer docs use the second method for Facebook Page post engagement rate (the sum of post rates divided by the number of posts), while Buffer's Takeaways pools interactions and reach first. The two methods can give different results.
- Separate organic and paid: likes, comments, views and total_interactions in Meta's API count organic data only; since 2026-11-03, Sprout includes paid activity in post-level Instagram views and engagements, which can lower the engagement rate of promoted posts.
Engagement rate definitions by platform and tool
| Platform or tool | Interactions (numerator) | Denominator | Notes |
|---|---|---|---|
| LinkedIn Page analytics | Clicks, reactions, comments, shares | Impressions: content at least 50% on screen for 300 milliseconds or more, or clicked | The Help Center defines it as interactions per impression; impressions and members reached are both labeled as estimates |
| Instagram (Meta API) | total_interactions: likes, saves, comments and shares, minus unlikes, unsaves and deleted comments | The API does not return an engagement rate; use views (plays or displays) or reach (unique accounts, estimated) | impressions is deprecated for media created on or after 2024-07-02, and requests in every API version return an error from 2025-04-21; data can be delayed by up to 48 hours and is stored for up to 2 years |
| Sprout Social | Total engagements per network, such as likes, comments and saves on Instagram | Impressions (Engagement Rate per Impression); post-level Instagram uses total views | Since 2026-11-03, post-level Instagram views and engagements include paid activity and views of Reels cross-posted to Facebook; its Public API still returns organic-only data for now |
| Hootsuite (Analytics API metrics reference) | Varies by network; for Instagram posts, the number of people who liked, commented, saved or shared | People who saw the content (Instagram, TikTok) or times displayed (Threads, Pinterest) | Facebook Page post engagement rate is the average of each post's engagement rate |
| Buffer Insights | Interactions; Takeaways also counts Instagram saves and LinkedIn comments | People who saw the content; Instagram Stories use interactions ÷ reach; LinkedIn personal posts use (reactions + comments) ÷ impressions | LinkedIn Page posts use the figure reported by LinkedIn; Buffer's website glossary says engagements ÷ impressions, which does not fully match its help center |
| Later (Instagram analytics) | Likes + comments + saves + shares | Reach; the overall rate uses the combined reach of Reels and static posts | Only the legacy Enterprise plan can customize the engagement rate formula |
| Metricool | Interactions | Reach; X and LinkedIn use impressions instead | Can be set to ×100 or ×1000; Instagram uses organic interactions and organic reach only; competitor engagement is average interactions ÷ followers |
Definitions are taken from the LinkedIn Help Center, Meta for Developers (the Instagram Media Insights reference and the Instagram Platform changelog), the Sprout Social Help Center, Hootsuite developer docs, the Buffer Help Center and website, the Later Help Center and the Metricool Help Center, accessed on 2026-11-15. X's official help page returned 403 during this visit and is not included. Platforms and tools change their metrics, so check the latest documentation.
Common uses
- Compare content performance: compare posts, formats or topics on the same platform with the same formula to find what drives more interaction.
- Track trends: follow the account's engagement rate week by week or month by month, and adjust the content plan along with posting frequency and timing.
- Evaluate paid promotion: look at organic and paid engagement rates separately, so that the large number of paid views does not drag the overall figure down and lead you to misjudge content quality.
- Rough competitor comparison: when you cannot see another account's analytics, divide its public interactions by its followers; Metricool's competitor analysis uses this method.
- Client reporting: agencies state the formula next to engagement rate in monthly reports so clients can compare it with the previous period.
Limitations and Precautions
- No single standard: which actions count in the numerator, and whether the denominator is impressions, views, reach or followers, differ across platforms and tools, so numbers from different tools or platforms are not directly comparable.
- Platform metrics change: Instagram has replaced impressions with views, so the denominator means something different in old and new reports; read trend charts that span the switch with care.
- Reach is an estimate: Meta labels reach as an estimated metric, and LinkedIn also labels impressions and members reached as estimates; ratios swing more when there are only a few posts.
- Data has delays and update windows: Meta API metrics can be delayed by up to 48 hours and are stored for up to 2 years; Later updates post performance data only for 2 weeks after publishing, after which it may differ slightly from what Instagram shows.
- Some interactions are unavailable: Meta's docs say story replies are not returned for stories created in Europe and Japan (shown as 0); Buffer also says reshare data for LinkedIn personal posts is not reliable enough, so it is not counted.
- A high engagement rate is not the same as business results: it does not reflect conversions or sales after the click, so evaluate it together with link clicks and conversion data.
Common misconceptions
Is engagement rate simply engagements ÷ followers?
Not necessarily. LinkedIn Page analytics and Sprout use impressions as the denominator, while Later, Metricool (on most networks) and Buffer for Instagram Stories use reach; follower count is more common in competitor analysis, where you cannot see the other account's analytics. Always state the denominator when you report engagement rate.
The same post shows different engagement rates in Instagram and in my scheduling tool. Is the tool wrong?
Usually not. Differences can come from the denominator (views or reach), whether paid promotion is included, whether views of Reels cross-posted to Facebook are included, and data delays or update windows. Check the formula in the tool's help center before deciding something is wrong.
Engagement rate dropped after I promoted a post. Does that mean the content got worse?
Not necessarily. Sprout explains that paid promotion usually grows views much faster than engagements; when the denominator includes paid views, promoted posts naturally show a lower engagement rate. Use the organic engagement rate when judging content quality.
A higher engagement rate is better, so is it the only metric you need?
No. Engagement rate is a ratio, and a post with very little reach can still score high. Buffer's engagement report also notes that a higher engagement rate does not mean more total engagement, so read it alongside reach, views, clicks and conversions.
Example
A brand publishes a post on its LinkedIn Page: 4,000 impressions, 60 reactions, 15 comments, 5 shares and 40 clicks, for 120 interactions in total. Using LinkedIn's definition, the engagement rate is 120 ÷ 4,000 = 3%. If the post reached 2,500 members, the rate by reach is 4.8%; if the Page has 10,000 followers, the rate by followers is only 1.2%. None of the three numbers is wrong; they answer different questions, so state the formula in your report. The numbers are a fictional example for illustration.
Tools with engagement rate reporting
The tools below document their own engagement rate formulas in their help centers or developer docs, and their numerators and denominators differ. When you switch tools or combine reports, check the formula before comparing numbers.
Visit SocialKit Tool Directory to see all products and filters.
FAQ
How do you calculate engagement rate?
The general formula is engagement rate = interactions ÷ denominator × 100%, where the denominator can be impressions (or views), reach or followers. Under the platform's own definition, a LinkedIn Page uses (clicks + reactions + comments + shares) ÷ impressions.
What is a normal engagement rate?
There is no single standard; it depends on platform, industry, account size and formula. Buffer has published per-platform medians based on its users' posts, but notes that each platform defines engagement differently, so compare only within the same platform.
Instagram no longer provides impressions. Can you still calculate engagement rate by impressions?
Meta deprecated impressions in 2025 and replaced it with views (the number of plays or displays). For new content, use views or reach as the denominator instead; for example, Sprout calculates post-level Instagram engagement rate from total views. Watch for the change in definition when comparing across time.
Why does Metricool show an engagement rate like 134?
In Brand Settings, Metricool lets you express the formula as interactions per 100 or per 1,000 people reached. With ×1000, 134 means about 134 interactions per 1,000 people reached, equivalent to 13.4%.
Sources
- LinkedIn Help: Content analytics for your LinkedIn Page
- Meta for Developers: Instagram Media Insights reference
- Meta for Developers: Instagram Platform changelog
- Sprout Social Help Center: How do I use the Profile Performance Report?
- Sprout Social Help Center: Updates to Post-Level Instagram Views and Engagements in Sprout Reporting (Nov 2026)
- Hootsuite developer docs: Metrics Reference
- Buffer Help Center: Using Insights in Buffer
- Buffer Help Center: Why your data in Buffer Insights might look different from native analytics
- Buffer:What is Engagement Rate?
- Buffer:Engagement in 2025: Where Social Media Users Are Actually Interacting
- Later Help Center: Later's Instagram Analytics
- Metricool Help Center: How engagement is calculated in Metricool
The pages above were accessed on 2026-11-15. Platform APIs and product features may change, so check the official documentation.